
ESP32 collects data for learning
A model learns from data – and the best data is the data from your own classroom. In this lesson the ESP32 measures temperature, humidity and light, you tell it what the state is (“pleasant”, “stuffy”…), and Python saves everything into a table. This is the process of labeling data from the lesson Data – food for AI, only with real sensors.
Wiring
| Part | Pin | ESP32 |
|---|---|---|
| DHT11 | VCC / GND / DATA | 3V3 / GND / GPIO4 |
| LDR module | VCC / GND / AO | 3V3 / GND / GPIO34 |
The same as in the lessons DHT11 and measuring light. If you have built the smart classroom, the DHT11 is already in the right place.
The ESP32 program: measurement and label
// ESP32 – collecting data for artificial intelligence
// DHT11 (DATA) -> GPIO4, LDR module (AO) -> GPIO34
// Every 3 seconds it sends a row: temperature,humidity,light,state
// You set the state (label) with a letter in the Serial Monitor: c = cold, p = pleasant,
// w = warm, s = stuffy, x = pause (nothing is recorded)
#include <DHT.h>

const int DHT_PIN = 4;
const int LDR_PIN = 34;
DHT dht(DHT_PIN, DHT11);

String state = "";              // the current label; empty = we don't record
unsigned long last = 0;

void setup() {
  Serial.begin(115200);
  dht.begin();
  Serial.println("temperature,humidity,light,state");   // the header of the CSV table
}

void loop() {
  // 1) has the user sent a new label?
  if (Serial.available()) {
    char c = Serial.read();
    if (c == 'c') state = "cold";
    else if (c == 'p') state = "pleasant";
    else if (c == 'w') state = "warm";
    else if (c == 's') state = "stuffy";
    else if (c == 'x') state = "";
  }

  // 2) measuring every 3 s, without delay() – so that Serial can receive letters all the time
  if (millis() - last >= 3000) {
    last = millis();
    float t = dht.readTemperature();
    float h = dht.readHumidity();
    int light = analogRead(LDR_PIN);
    if (isnan(t) || isnan(h) || state == "") {
      return;                    // failed measurement or pause – we don't record
    }
    Serial.print(t, 1);
    Serial.print(",");
    Serial.print(h, 0);
    Serial.print(",");
    Serial.print(light);
    Serial.print(",");
    Serial.println(state);
  }
}
- Every 3 seconds the ESP32 sends one row of the CSV table, for example
24.1,71,1930,stuffy. - You set the label: in the Serial Monitor type the letter
p(pleasant),c(cold),w(warm) ors(stuffy) and press Enter. The letterxpauses the recording. - The measuring is done with
millis(), so the ESP32 constantly “listens” to Serial and immediately accepts a new label.
How to collect good data
- Varied: record in the morning and in the afternoon, with the window open and closed, before and after a break, when there are many and few people in the classroom.
- Fair labeling: change the label only when the state really changes; let several students decide on the label, not just one.
- Enough examples of each kind: at least 15–20 rows for each state (see task 1).
- If you can't get a state naturally, “create” it carefully: breath or a palm on the sensor (warm), a glass of warm water next to the sensor (humid).
Python saves the data to a file
You can copy the rows from the Serial Monitor into a file by hand. It is easier to let Python do it, with the library pyserial (pip install pyserial). Before running it, close the Serial Monitor – only one program can use the port.
# Saving the rows sent by the ESP32 to the file measurements.csv (Python + the pyserial library)
# Installation: pip install pyserial   ·   Close the Serial Monitor in the Arduino IDE before running!
import serial

PORT = "COM3"          # on Windows for example COM3 (see Arduino IDE → Tools → Port); on Linux /dev/ttyUSB0
BAUD = 115200
NUM_ROWS = 100      # how many measurements to save

conn = serial.Serial(PORT, BAUD, timeout=10)
with open("measurements.csv", "w", encoding="utf-8") as f:
    saved = 0
    header_written = False
    while saved < NUM_ROWS:
        row = conn.readline().decode("utf-8", errors="ignore").strip()
        if not row:
            continue                       # nothing arrived (the waiting time ran out)
        print(row)
        if row.startswith("temperature"):  # we write the header only once
            if not header_written:
                f.write(row + "\n")
                header_written = True
            continue
        f.write(row + "\n")
        saved += 1
conn.close()
print("Saved", saved, "measurements to measurements.csv")
Do you still send labels from the Serial Monitor? You can't – the port is busy. That is why it is simpler to do the measurements in two parts: first everything with the label “pleasant” (send p, close the Serial Monitor, run Python), and then the next state. The ESP32 remembers the last label until you turn off the power – but it resets when the port is opened, so send the label again. Task 2 has a better solution: a button on the board.
Sample data and a first look
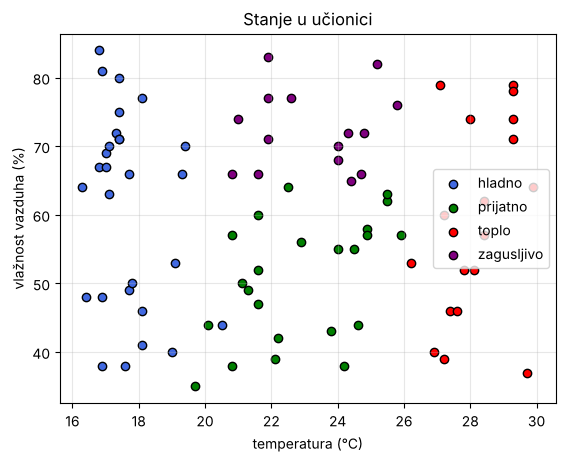
For the next lesson we have prepared a sample table classroom.csv with 84 measurements (temperature, humidity, state). The values are realistic for a classroom, but they were prepared for practice; your measurements will look different – and that is good, because your model will learn exactly your classroom.
Show the table classroom.csv (copy it into a file)
temperature,humidity,state
20.5,44,cold
17.0,69,cold
17.3,72,cold
16.8,67,cold
19.0,40,cold
22.1,39,pleasant
19.4,70,cold
21.9,71,stuffy
17.7,49,cold
24.8,72,stuffy
29.3,71,warm
24.2,38,pleasant
29.7,37,warm
23.8,43,pleasant
20.1,44,pleasant
24.0,70,stuffy
27.4,46,warm
17.4,71,cold
24.9,58,pleasant
17.4,80,cold
16.9,38,cold
24.7,66,stuffy
25.5,62,pleasant
22.5,64,pleasant
21.1,50,pleasant
27.1,79,warm
26.9,40,warm
24.0,68,stuffy
22.9,56,pleasant
26.2,53,warm
17.0,67,cold
21.9,83,stuffy
20.8,66,stuffy
21.9,77,stuffy
17.1,70,cold
24.0,55,pleasant
20.8,57,pleasant
24.3,72,stuffy
27.2,39,warm
27.8,52,warm
22.6,77,stuffy
16.9,81,cold
25.8,76,stuffy
25.5,63,pleasant
28.4,57,warm
16.3,64,cold
21.0,74,stuffy
17.6,38,cold
19.1,53,cold
17.8,50,cold
21.6,66,stuffy
17.1,63,cold
21.6,52,pleasant
28.4,62,warm
28.1,52,warm
25.9,57,pleasant
21.3,49,pleasant
18.1,46,cold
18.1,77,cold
19.3,66,cold
27.6,46,warm
19.7,35,pleasant
24.5,55,pleasant
29.3,79,warm
28.0,74,warm
25.2,82,stuffy
16.8,84,cold
29.3,78,warm
27.2,60,warm
21.6,60,pleasant
17.4,75,cold
21.6,47,pleasant
16.9,48,cold
22.2,42,pleasant
20.8,38,pleasant
17.4,71,cold
18.1,41,cold
29.3,74,warm
16.4,48,cold
24.6,44,pleasant
24.9,57,pleasant
24.4,65,stuffy
17.7,66,cold
29.9,64,warm
# An overview of the collected data: how many examples there are and how they look on a chart
import csv
import matplotlib.pyplot as plt

data = []
with open("classroom.csv", encoding="utf-8") as f:
    for row in csv.DictReader(f):
        data.append((float(row["temperature"]), float(row["humidity"]), row["state"]))

colors = {"cold": "royalblue", "pleasant": "green", "warm": "red", "stuffy": "purple"}
for state, color in colors.items():
    t = [p[0] for p in data if p[2] == state]
    h = [p[1] for p in data if p[2] == state]
    print(f"{state:11} examples: {len(t):3}   average {sum(t) / len(t):.1f} °C, {sum(h) / len(h):.0f} %")
    plt.scatter(t, h, c=color, label=state, edgecolors="black")

plt.xlabel("temperature (°C)")
plt.ylabel("air humidity (%)")
plt.title("The state of the classroom")
plt.legend()
plt.grid(alpha=0.3)
plt.show()
Program output:
cold        examples:  28   average 17.7 °C, 61 %
pleasant    examples:  23   average 22.9 °C, 51 %
warm        examples:  18   average 28.2 °C, 59 %
stuffy      examples:  15   average 23.3 °C, 72 %
Choose “data monitors”: at every break they start the recording and decide on the label together. After a week the class has its own table for the next lesson.
Common misconceptions
- “The more rows, the better – no matter what they are like” – 1000 rows recorded in the same 10 minutes are worth less than 100 rows from different days and situations.
- “A sensor always measures correctly” – the DHT11 has an error of about ±2 °C and sometimes fails to measure; that is why the program checks isnan(), and the data is cleaned afterwards.
Practice tasks
Try it yourself first, and only then open the solution.
- Write a program that checks whether the data is balanced: print the number of examples per state and warn if a state has fewer than 10 examples.
- Instead of letters from the Serial Monitor, change the label with a button on GPIO15 (each press: the next state). What needs to be changed in the ESP32 program?
- Write a program that removes impossible measurements from the data (temperature outside −10…50 °C, humidity outside 0…100%, empty fields) and saves the rest to a new file.
Solution 1: balance
# Task: is the data balanced? Warn if a class has fewer than 10 examples
import csv

count = {}
with open("classroom.csv", encoding="utf-8") as f:
    for row in csv.DictReader(f):
        count[row["state"]] = count.get(row["state"], 0) + 1

for state, n in sorted(count.items(), key=lambda p: -p[1]):
    warning = "  <- too few examples, record more!" if n < 10 else ""
    print(f"{state:11} {n:3}{warning}")
Program output:
cold         28
pleasant     23
warm         18
stuffy       15
Solution 2: a button instead of the Serial Monitor
Add const int BUTTON = 15;, in setup() pinMode(BUTTON, INPUT_PULLUP);, and the array const char* LABELS[] = {"cold", "pleasant", "warm", "stuffy"}; with the variable int k = 1;. In loop(), instead of reading Serial, check for the button change HIGH → LOW (as in the lesson LED, button and PWM) and do k = (k + 1) % 4; state = LABELS[k];. This way Python can keep the port open, and you change the label with the button. You can also show the current label with the color of the light ring.
Solution 3: cleaning the data
# Task: cleaning the data – remove impossible measurements and save the rest
import csv

raw_rows = [  # some measurements with errors (for example a loose contact on the sensor)
    {"temperature": "22.5", "humidity": "48", "state": "pleasant"},
    {"temperature": "-127.0", "humidity": "48", "state": "pleasant"},   # sensor error
    {"temperature": "27.1", "humidity": "155", "state": "warm"},       # humidity over 100 %
    {"temperature": "", "humidity": "60", "state": "cold"},           # a missing value
    {"temperature": "18.2", "humidity": "62", "state": "cold"},
]


def is_valid(row):
    try:
        t = float(row["temperature"])
        h = float(row["humidity"])
    except ValueError:              # an empty field or text instead of a number
        return False
    return -10 <= t <= 50 and 0 <= h <= 100


cleaned = [row for row in raw_rows if is_valid(row)]
print(len(cleaned), "of", len(raw_rows), "measurements remained")
with open("measurements_clean.csv", "w", encoding="utf-8", newline="") as f:
    writer = csv.DictWriter(f, fieldnames=["temperature", "humidity", "state"])
    writer.writeheader()
    writer.writerows(cleaned)
Program output:
2 of 5 measurements remained
Check your knowledge
Open the quiz
Quiz: collecting data
1. Who sets the label (state) in this lesson?
2. Why does the ESP32 measure with millis() and not delay(3000)?
3. Why should you close the Serial Monitor before running the Python program?
4. Which data is better for learning?