
Getting ready: Python, libraries and data
In this module we no longer just explain artificial intelligence – we program it. We use Python, the language used most in machine learning. In the first lesson we prepare the computer, load a table of data and draw it.
Prior knowledge: variables, lists, loops and functions in Python – if any of that isn't clear to you, review the lessons Lists (SR), Loops (SR) and Functions (SR).
What we need
- Python 3 – if you don't have it yet, see the lesson Installation and the first program (SR).
- An editor: Thonny (the simplest for beginners) or VS Code.
- Three libraries:
numpy– fast calculations with numbers and tables;matplotlib– drawing charts;scikit-learn– ready-made machine learning algorithms (we use them only from lesson 16).
Installing the libraries
Open the Command Prompt (Windows: the Start key, type cmd) and enter:
pip install numpy matplotlib scikit-learn
In Thonny you can do the same through the menu Tools → Manage packages: search for each library and click Install.
Check that everything is installed with this program:
# Check: are the libraries for this module installed
import sys

print("Python version:", sys.version.split()[0])

for name in ["numpy", "matplotlib", "sklearn"]:
    try:
        module = __import__(name)
        print(f"{name:12} OK, version {module.__version__}")
    except ImportError:
        print(f"{name:12} is NOT installed – run: pip install {name if name != 'sklearn' else 'scikit-learn'}")
Output (the version numbers on your computer may be different):
Python version: 3.13.18
numpy        OK, version 2.5.3
matplotlib   OK, version 3.11.2
sklearn      OK, version 1.9.1
Data: a table of fruit
Throughout the module we use the same small table: 30 fruits (apples, bananas and oranges), for each fruit its mass in grams and length in centimeters, and a label – which type it is. Such a file is called a CSV file (comma-separated values) and it can also be opened in Excel.
In the folder where you keep your programs, create the file fruit.csv and copy this text into it:
The file fruit.csv:
mass,length,kind
152,7.5,apple
168,8.0,apple
140,7.2,apple
185,8.6,apple
175,8.1,apple
160,7.8,apple
195,8.9,apple
148,7.4,apple
172,8.3,apple
158,7.6,apple
120,19.0,banana
135,20.5,banana
118,17.5,banana
128,18.2,banana
140,21.0,banana
125,19.6,banana
132,18.8,banana
115,17.0,banana
138,20.1,banana
122,18.5,banana
210,8.4,orange
230,8.9,orange
195,8.0,orange
245,9.3,orange
220,8.7,orange
205,8.2,orange
238,9.1,orange
185,7.9,orange
215,8.6,orange
250,9.5,orange
The first row is the header (the column names); each next row is one example. We write the labels in lowercase letters, without spaces, so that they are easy to use in the programs.
Program 1: reading the table
# Reading the table fruit.csv and counting the examples of each type
import csv

data = []                                  # a list of rows: (mass, length, type)
with open("fruit.csv", encoding="utf-8") as f:
    for row in csv.DictReader(f):            # each row is a dictionary: {"mass": "152", ...}
        data.append((float(row["mass"]), float(row["length"]), row["kind"]))

print("Total examples:", len(data))
print("First three rows:", data[:3])

count = {}                                    # how many examples of each type there are
for mass, length, kind in data:
    count[kind] = count.get(kind, 0) + 1
print("By type:", count)

# the average mass of each type
for kind in count:
    masses = [m for m, d, v in data if v == kind]
    print(f"{kind:11} average mass: {sum(masses) / len(masses):.1f} g")
Program output:
Total examples: 30
First three rows: [(152.0, 7.5, 'apple'), (168.0, 8.0, 'apple'), (140.0, 7.2, 'apple')]
By type: {'apple': 10, 'banana': 10, 'orange': 10}
apple       average mass: 165.3 g
banana      average mass: 127.3 g
orange      average mass: 219.3 g
csv.DictReaderreads row by row and turns each row into a dictionary, for example{"mass": "152", "length": "7.5", "kind": "apple"}.- Numbers are read as text, so we convert them with the function
float(). - The average masses already tell us something: bananas are the lightest, oranges the heaviest – but apples and oranges partly overlap.
Program 2: a chart
# Drawing the data: each point is one fruit (x = mass, y = length)
import csv
import matplotlib.pyplot as plt

data = []
with open("fruit.csv", encoding="utf-8") as f:
    for row in csv.DictReader(f):
        data.append((float(row["mass"]), float(row["length"]), row["kind"]))

colors = {"apple": "red", "banana": "gold", "orange": "darkorange"}
markers = {"apple": "o", "banana": "s", "orange": "^"}

for kind in colors:
    x = [m for m, d, v in data if v == kind]
    y = [d for m, d, v in data if v == kind]
    plt.scatter(x, y, c=colors[kind], marker=markers[kind], label=kind, edgecolors="black")

plt.xlabel("mass (g)")
plt.ylabel("length (cm)")
plt.title("Fruit: mass and length")
plt.legend()
plt.grid(alpha=0.3)
plt.show()
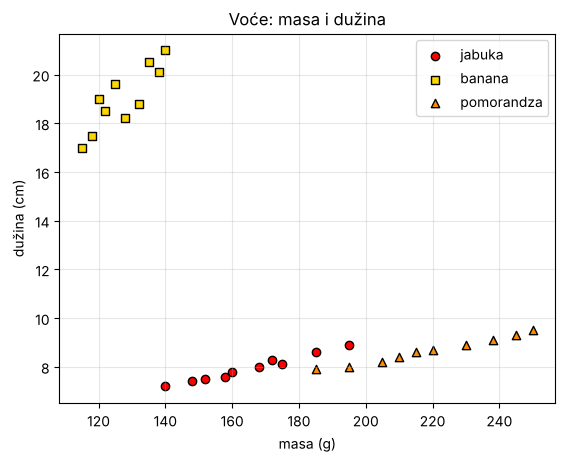
A chart is the best first step in every machine learning project: we immediately see that a banana is easy to recognize by its length, and that telling an apple from an orange is harder – for that we will need both features.
The first 15 minutes for installation and checking; then students type the reading program, and at the end they draw the chart and describe what they see on it.
Common misconceptions
- “AI needs a special programming language” – Python is an ordinary language; what is special are the libraries and the data.
- “The more libraries, the better” – for the first steps ordinary Python, lists and loops are enough – we use libraries when we understand what they do.
Practice tasks
Try it yourself first, and only then open the solution.
- Print the mass of the heaviest and the lightest apple.
- Add three pears to
fruit.csv(for example 180 g and 10 cm) and show them in green on the chart. - Calculate the average length of each type.
Solution 1: the heaviest and the lightest apple
# Task: the heaviest and the lightest apple
import csv

apples = []
with open("fruit.csv", encoding="utf-8") as f:
    for row in csv.DictReader(f):
        if row["kind"] == "apple":
            apples.append(float(row["mass"]))

print("The heaviest apple:", max(apples), "g")
print("The lightest apple:", min(apples), "g")
Program output:
The heaviest apple: 195.0 g
The lightest apple: 140.0 g
Solution 2: pears on the chart
At the end of the file fruit.csv add the rows:
180,10.2,pear
165,9.8,pear
195,10.6,pear
In the chart program, add a color and a marker for the new type: colors = {..., "pear": "green"} and markers = {..., "pear": "D"}. The loop for kind in colors will draw it by itself.
Solution 3: the average length
# Task: the average length of each type
import csv

lengths = {}                                   # type -> list of lengths
with open("fruit.csv", encoding="utf-8") as f:
    for row in csv.DictReader(f):
        lengths.setdefault(row["kind"], []).append(float(row["length"]))

for kind, lst in lengths.items():
    print(f"{kind:11} average length: {sum(lst) / len(lst):.1f} cm")
Program output:
apple       average length: 7.9 cm
banana      average length: 19.0 cm
orange      average length: 8.7 cm
By length the bananas clearly stand out, and the apples and oranges are almost the same.
Check your knowledge
Open the quiz
Quiz: getting ready for AI in Python
1. Which command installs the libraries?
2. What is a CSV file?
3. Why are values from a CSV file converted with the function float()?
4. What can you see on the fruit chart?